Geospatial and Sociocultural Analysis of Lethal Accusations in the 1692 Salem Witch Trials
The Data:
As mentioned in the introduction, this research was conducted based on a dataset[1]Compiled by the site’s author, Katya Beisel. of 30 convicted witches, 20 of whom were executed, three of whom died under other circumstances, six of whom were pardoned, and one of whom escaped custody after her conviction. This dataset reflects cases of lethal accusations, meaning that everyone in this dataset was either legally bound for death because they were convicted of witchcraft, which was a capital offense, or they died as a result of their arrest. The fact that several did not die reflects the various avenues of recourse of the culture and legal system in which the Salem Witch Trials occurred.

General Insights:
Of the 30 witches in the dataset, all but seven were women. The average age for both men and women was 54. The average age for pardoned witches was approximately 41. The majority of executions were carried out on September 22, 1692 with eight deaths – although it would have been nine if Dorcas Hoar had not confessed – followed by five deaths on August 19, 1692. All but nine of the accused witches were known to the legal system through prior allegations of witchcraft or other crimes against them or their relatives. All but four plead guilty, with Giles Corey famously standing mute and the remaining three confessing to witchcraft. These include Tituba, Dorcas Hoar and Sarah Wardwell, whose husband also confessed but ultimately retracted that confession and was executed. All three of the accused witches who confessed or plead guilty survived the trials. In terms of geospatial data, eleven of the accused witches lived in Salem Village, seven lived in Andover, three lived in Salem Town, two lived in Topsfield, and individual witches also lived in Amesbury, Beverly, Billerica, Marblehead, Rowley and Salisbury. George Burroughs, the only witch in the dataset who did not live in the Massachusetts Bay Colony, lived in Wells, Maine. An examination of arrest dates and residences reveals that the earliest arrests occurred in Salem Village.
These insights from the data reveal a preliminary profile of accused witches in 1692. An accused witch was usually a woman in her fifties, had prior criminal allegations against her or her relatives, and lived in Salem Village or Andover. Analysis of the accused witches’ fates and pleas reveals some disturbing insights into the justice system of New England. With the exception of confessing and essentially changing one’s plea, being pardoned due to pregnancy, escaping, or dying in custody, all of the accused witches who plead not guilty were executed.
The profile of a New England witch that emerges from this dataset is consistent with extant scholarship of witchcraft panics in colonial America and elsewhere. Preeminent Salem Witch Trials scholars such as Mary Beth Norton[2]Norton, Mary Beth. 2010. In The Devil’s Snare. New York: Vintage eBooks., and Marilynne Roach[3]Roach, Marilynne K. 2013. Six Women Of Salem. New York: Da Capo Press. have discussed the impact of prior allegations of witchcraft and other crimes at length in their published work, as well as in documentaries.
What About That Salem Village vs. Salem Town Narrative?
Initial analysis of the dataset has several implications for theories or narratives that frame the Salem Witch Trials as Salem Villagers’ vendetta against their wealthier and less religious neighbors. The findings that most undermine this narrative of the trials are the ones regarding where accused witches lived. More than a third of the accused witches lived in Salem Village, not in town. Nearly another third lived in Andover, and just three accused witches in the dataset lived in Salem Town. However, it is true that the majority of the accusers indicated in the dataset lived in Salem Village.

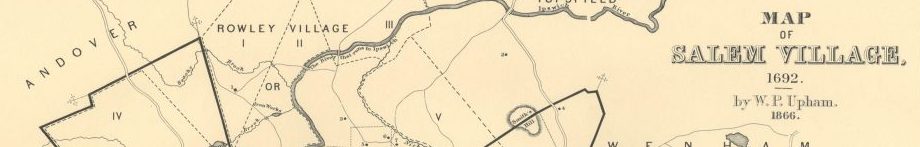
Here is a map[4]This map is the original work of the site’s author, Katya Beisel., created using ArcGIS, describing the geography of witchcraft accusations in 1692. The data was imported from an augmented CSV file based on the dataset referenced through this analysis. One layer is a heat map, demonstrating hot spots of greater frequency of accusations. The second layer, using the same source information, plots each accused witch in the dataset color-coded into three distinct categories. These categories and the insights derived from them were the primary findings of my research.
The first category, codified in the dataset and in the interactive map above as “scorned”, consisted of individuals who were social outcasts, failed to conform to the norms of puritan New England, or had contentious relationships with their neighbors. These scorned accused witches include the beggar Sarah Good, the slave Tituba, Sarah Osbourne, who married her indentured servant, previously accused witches like Bridget Bishop, and former Salem Village minister George Burroughs, who endured several heated legal battles with villagers over his salary. Of the 30 accused witches included in the dataset, 16 fit into the “scorned” category. Several of the earliest arrests belong to this category. Scorned witches are indicated by a black x on the map.
The second category consisted of “critics” of the proceedings, such as the Coreys, John Proctor, Martha Carrier, and Rebecca Nurse. Several of the accused and executed witches in 1692 are believed to have made derisive or negative remarks about the trials or the “afflicted girls”. That these sentiments would have aroused a degree of ire from court officials and others is generally accepted by scholars, particularly in the context of puritan New England[5]Schiff, Stacy. 2015. The Witches. New York: Little, Brown and Company.. Eight of the accused witches in the dataset fall into this category and are indicated on the map by a purple x. As reflected in the dataset, accusations against outspoken critics of the trials began a month after the earliest arrests.
The remaining six individuals are marked both in the dataset and in the interactive map as “other”. These accused witches are indicated on the map with an orange x.
References
| ↑1 | Compiled by the site’s author, Katya Beisel. |
|---|---|
| ↑2 | Norton, Mary Beth. 2010. In The Devil’s Snare. New York: Vintage eBooks. |
| ↑3 | Roach, Marilynne K. 2013. Six Women Of Salem. New York: Da Capo Press. |
| ↑4 | This map is the original work of the site’s author, Katya Beisel. |
| ↑5 | Schiff, Stacy. 2015. The Witches. New York: Little, Brown and Company. |